Voices is pleased to release the newest version of our regional and statewide infographics!
Each of the eight regional infographics gives a snapshot of how children are doing in both the region and its localities.
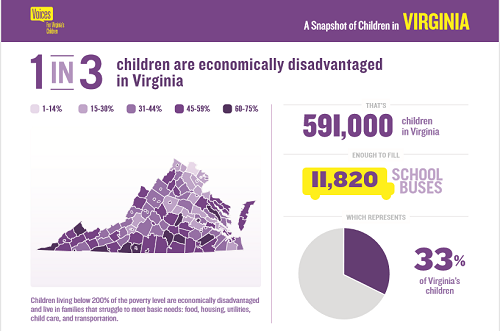
The Virginia infographic focuses on how children fare statewide. It also features a new back page, where we spotlight an important and timely topic about children in Virginia. This year, we shine a spotlight on the changing demographics of our child population.
What are some ways you can use the infographics?
• Take them to a meeting with a policymaker to share a fact about child well-being in his/her district.
• Share them with your local networks to start a conversation on child well-being in your area.
• Use them in a presentation to talk about child well-being.
• Show them to your local elected officials, such as school board members, county or city supervisors, etc.
• Use them as a conversation starter with your friends.
Whatever way you choose to use the infographics, we hope you find them valuable. Check them out!
Read More Blog Posts