Medicaid and SNAP are lifelines for Virginia’s families
The interactive maps below demonstrate the projected harm in terms of coverage, funding, and economic development losses posed by H.R.1 to Virginia’s young people and the adults/caregivers who support them.
Projected Harm to Coverage, Funding, and Economic Development
719,000
of Virginia's children benefited from Medicaid, SNAP, or both – representing 36% of children in the state
These cuts disproportionately endanger Black and Latino families, with 59% of Black children and 43% of Latino children in Virginia benefiting from one or both programs.
$1,624
potential out-of-pocket costs for a family of four on Medicaid
A family of four just above the federal poverty level (an income of $32,471.50) will be expected to pay up to $1,624, out of pocket, for covered services that are not exempted. This provision will allow providers to deny Medicaid enrollees certain services if they are unable to pay their shared cost.
Up to $6.5
billion in potential economic development losses due to SNAP cuts
Total projected economic development losses due to SNAP cuts in VA (projections are based on U.S. Department of Agriculture (USDA) and Food Action Research Center (FRAC) estimates).
$32.7
billion in possible funding loss to Medicaid & SNAP
By 2034, Virginians stand to lose roughly $32.7 billion in Medicaid and SNAP funding (out of the roughly $1.2 trillion estimated national cuts).
Projected Total SNAP & Medicaid Funding Loss in Virginia by 2034
Source: This map draws from the funding-related sourceThis map draws from the funding-related sources listed in the Medicaid and SNAP funding loss maps below.s listed above.
Percent of Households Receiving Medicaid and SNAP Nationally
Responsive iframe:
Source:Voices gained permission to use this embedded map from the author of this article published through the Urban Institute. Click this link for more information on the methodology.
Total Percent of People Enrolled in Medicaid in Virginia (2023)
The changes to eligibility for SNAP and Medicaid will have downstream effects on students’ access to free school meals and other child nutrition programs. Participation in Medicaid and SNAP streamline access to programs like free and reduced-price school meals, WIC, Summer EBT (SUN Bucks), Summer Food Service Programs, At-Risk Afterschool Meal Programs, and Head Start.
Percent of Children Enrolled in Medicaid/CHIP in Virginia (2023)
Notably, the percentage of children enrolled in Medicaid and CHIP (the Children’s Health Insurance Program, called FAMIS in Virginia) is higher in many areas than levels of total enrollment. For instance, in Petersburg, nearly 1 in 2 children get their health insurance through Medicaid/CHIP.
Source: Both maps, which provide a baseline of the Medicaid/CHIP enrollment landscape, use publicly available data from Georgetown’s Center for Children and Families’ (CCF) reporting of American Community Survey (ACS) Public Use Micro Data (PUMS) in 2023.
Projected Medicaid Funding Loss in Virginia by 2034
Source: Medicaid funding loss calculations based on the Kaiser Family Foundation’s (KFF) reporting of CBO national estimates ($990 billion) and KFF’s calculation of corresponding state-level estimates ($29 billion in Virginia, with low to high end funding cuts ranging from $21 to $36 billion).
Projected Medicaid Coverage Loss in Virginia by 2034 Due to Work Requirements
Source: Medicaid coverage loss calculations based on the Center on Budget and Policy Priorities’ (CBPP) reporting of Congressional Budget Office (CBO) estimates of Medicaid coverage loss by state with the implementation of work requirements (7,107,000 nationally and 188,000 in Virginia). Percentages of those covered by Medicaid in 2023 come from Georgetown University’s Center for Children and Families’ reporting of American Community Survey Public Use Micro Data (PUMS) in 2023.
Like overall funding losses, the largest funding and coverage cuts are in Fairfax County, Norfolk City, Richmond City, Virginia Beach City, and Henrico County.
Rural Virginia Hospitals At-Risk of Closing/Scaling Back Services
Source: Data for hospital coordinates is publicly available here (last updated November 2024). Data on potential hospital closings/service reductions based on Senate letter identifying rural hospitals with negative margins for three straight years and at least 10% of recorded payments from Medicaid.
Hospital closures are concentrated in many of the same areas where there are large percentages of Medicaid enrollees.
Recommended Resource:
To see rates of Medicaid/CHIP enrollment by county and additional age-subgroups (2023), please refer to Georgetown’s Center for Children and Families’ map of Virginia based on ACS PUMS data. To see national estimates of people at risk of becoming uninsured each year, see this report based on CBO data.
Source: SNAP funding loss based on the July 21, 2025, CBO national estimates ($187 billion). In this case, state estimates were allocated using enrollment proportions reported in the U.S. Census Bureau’s 2019-2023 American Community Survey 5-Year Estimates of national and state SNAP household totals. Economic development loss projections draw from U.S. Department of Agriculture (USDA) and Food Action Research Center (FRAC) estimates of $1.54 and $1.79 per dollar, respectively.
Projected Number of Households at Risk of Losing Some or All of Their SNAP Benefits by 2034
In addition to the coverage loss mapped above, The Urban Institute predicts average benefit reductions totaling $112 per month for Virginia’s families. Using Feeding America’s average meal cost for Virginia ($3.64), this equates to the loss of 31 meals each month or roughly a meal a day due to SNAP cuts.
Source:State-level SNAP coverage loss based on Urban Institute’s report estimating roughly 447,000 households are at risk of losing all or some of their SNAP benefits. The Commonwealth Institute (TCI) replicated a similar finding in their report here, with an estimated 445,000 households losing coverage. These estimates were allocated to the county level using the U.S. Census Bureau’s 2019-2023 American Community Survey 5-Year Estimates of state SNAP household totals.
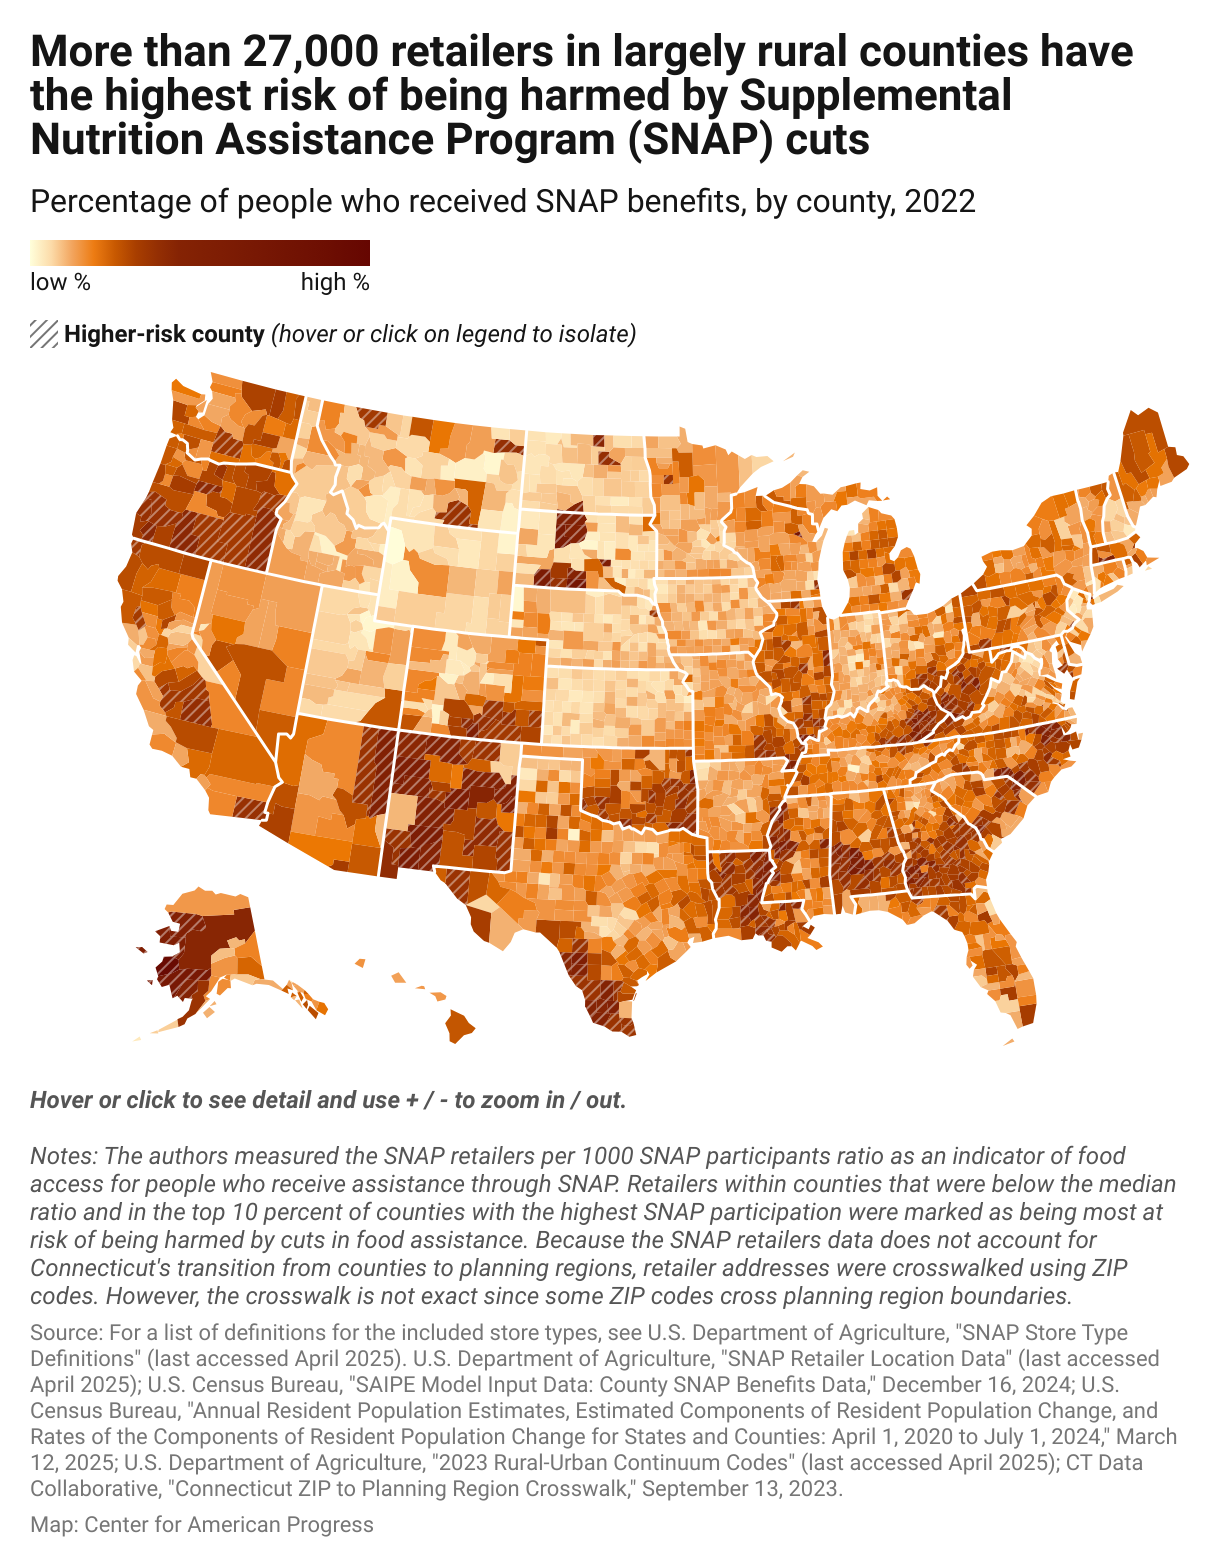
Percent of SNAP Enrollment, Number of SNAP Retailers, and At-Risk Retailers
Source: Voices obtained permission to use this embedded map from the authors of this article published through the Center for American Progress (CAP). Click this link for more information on the methodology.
Data Limitations
All projections are rooted in past trends and cannot account for future policy behavior at the state level (i.e., state-level investments, future error rates, work requirement implementation, individual behavioral responses, etc.). As mentioned above, allocating state-level data to the county level assumes proportional impact in all the maps. For the Medicaid maps, it is important to note Virginia authorized Medicaid expansion in 2018 and the policy went into effect Jan 1, 2019. The COVID-19 pandemic impacted the roll-out, and then Medicaid unwinding occurred April 2023, to the end of November 2024. These unique policy changes during the past five-years are a limitation when using the most recent (as of September 2025) five-year Census enrollment estimates to predict Medicaid losses. Furthermore, the SNAP funding map should be interpreted with additional caution given that national funding loss estimates were translated to the state and then county level based on household-level enrollment proportions. As more up-to-date estimates emerge, Voices plans to update the maps.
Medicaid & SNAP Terminology
Key Terms
Medicaid: Medicaid is a public health insurance program that covers a wide range of services, including doctor visits, hospital care, prescription drugs, mental health treatment, long-term care, and preventive services. Such coverage ensures low-income children, adults, older adults, and people with disabilities can access the care they need without facing crushing medical costs.
SNAP: The Supplemental Nutrition Assistance Program (SNAP) provides similar vulnerable populations, with additional funds to access nutritious foods. This prevents food insecurity, promotes health, and respects human dignity, which benefits all Virginians, not simply those enrolled.
Coverage Loss: When a person is no longer enrolled in their state’s Medicaid program, often due to changes in eligibility like increased income, failing to complete paperwork, or falling out of compliance with state-imposed requirements such as work requirements.
Funding Loss: This typically refers to a reduction in the federal government’s financial contribution to the state’s Medicaid program, which can lead to the state facing budget shortfalls and potentially cutting or reducing services for enrollees, resulting in increased disenrollment or individuals having to pay more out-of-pocket for healthcare.
Transforming the lives of young people requires us to transform systems through our evidence-based, community-informed policy change. Your contribution to Voices provides us with the vital resources we need to continue our advocacy.