
It’s that time of year where we start to think of the many different things we can do in the next year to be a better version of ourselves.
If you haven’t been able to think of a resolution yet, Voices has one guaranteed to bring you more knowledge in 2017: learn more about how children in your community are faring by using Voices’ data and interactive maps!
We’ve been hard at work these last few weeks to ensure our KIDS COUNT Data Center has the most up-to-date data for your use. With the release of the 2015 American Community Survey and the Small Area Poverty Estimates in December, the poverty indicators in the Data Center are now updated to 2015 data, with more updates on other topics to come in the following weeks.
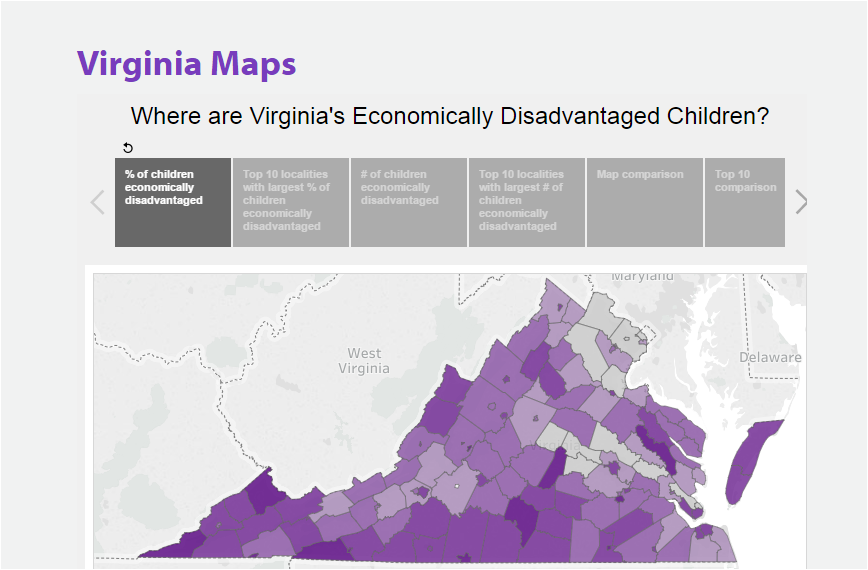
Most exciting of all, you can now go to our website and use our new interactive map to get a snapshot of where children who are economically disadvantaged live across the Commonwealth. Learn which localities have the highest number and highest percentage of children economically disadvantaged. Hint: they aren’t the same localities, with one glaring exception…
So what are you waiting for? Check it out!
Happy New Year and well wishes for data exploring.